top of page
BI / Data Visualization
Role
UX Architect, IC
Client
Multiple
Timeline
2022 - 2025
Data Visualizations
I specialize in transforming complex data sets into intuitive, actionable dashboards that drive strategic decision-making. My work focuses on not just presenting numbers, but telling a story that empowers users to understand performance, identify opportunities, and mitigate risks.
My experience spans highly regulated and data-intensive sectors, including:
-
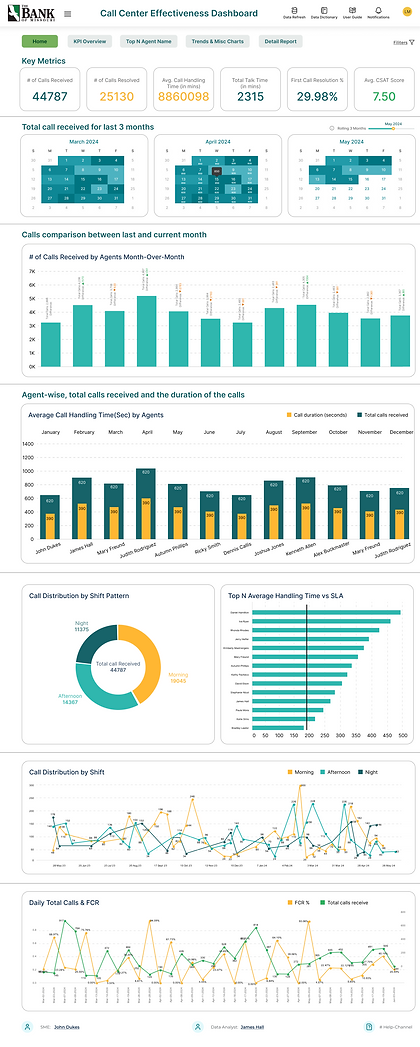
Financial Services (Community Bank): Developing dashboards to monitor key performance indicators for regulatory compliance, branch performance, customer lifetime value, and loan portfolio health.
-
Life Sciences (Drug Development & Clinical Trials): Creating visualizations that track clinical trial progress, manage patient recruitment funnels, and analyze drug efficacy and safety data to accelerate decision-making from lab to market.


bottom of page